Validation Testing
One question you need to ask when you consider using a flight simulation is, "How accurate is it?" No flight simulation is worth using if it doesn't accurately predict the responses of the real vehicle. "Validation testing" takes the results from the flight test of a real aircraft and tasks the simulation with reproducing them. If the simulation can come close to reproducing the responses of the real airplane, then we know that the math and physics within the simulation are correct and that the code embodying them has been written correctly. A good match is referred to as having "good correlation".
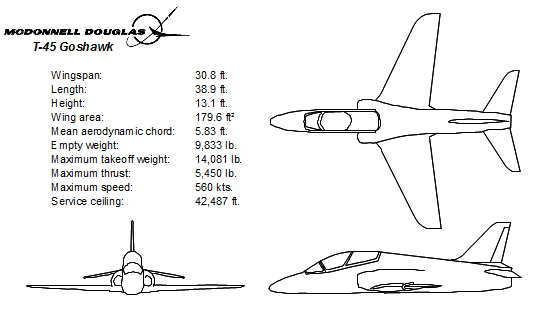
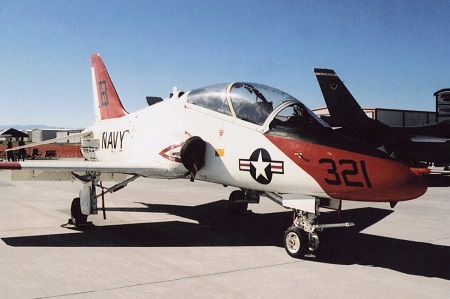
To validate Multi-Sim, we used data from the flight test of a U.S. Navy T-45 Goshawk training aircraft. The T-45 is a two-seat, tandem, single-engine jet. (Click the image at right to enlarge.) It began service with the Navy in the early 1990s and is in use today. Prior to its being accepted by the Navy for use aboard aircraft carriers, it underwent extensive flight testing to evaluate its flight dynamics and flying qualities.
The flight test of interest to us included two maneuvers that are commonly used to evaluate the flight dynamics of an aircraft, a "stabilator doublet" and a "rudder doublet". The aircraft enters each maneuver trimmed and in straight and level flight. For the stabilator doublet, the pilot first pushes the stick forward, then pulls the stick back an approximately equal displacment, then allows the stick to return to its trim position. This perturbs the aircraft from level flight and stimulates both its short-period and phugoid responses. For the rudder doublet, the pilot pushes on one rudder pedal, then pushes on the other rudder pedal approximately the same displacement, then allows the rudder to return to center. This stimulates the aircraft's lateral/directional responses.
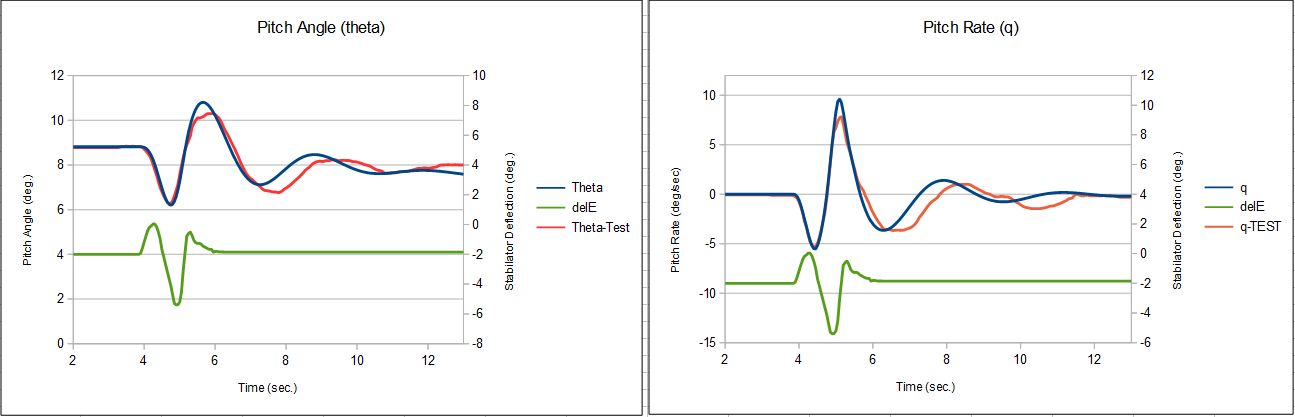
To the left, you can see the results of the stabilator doublet. (Click to enlarge.) The left-hand plot shows the pitch angle of the aircraft and the plot on the right shows the pitch rate. In each plot, the green curve is the measured position of the real T-45's stabilator during the maneuver. The test begins with the stabilator trimmed at about -2 degrees. At about 4 seconds, the pilot performs the doublet, pushing, then pulling the stick. The red curve is the measured response of the real T-45 to the control input. In Multi-Sim, we trimmed the simulated T-45 to the same airspeed and angle of attack as the real airplane. Then we fed the measured stabilator data into Multi-Sim to control the simulated T-45's stabilator. The blue curves show the response of the simulated aircraft. The correlation is quite good. The flight test stabilator data was digitized from second generation strip-chart curves and there is likely a significant loss of fidelity from the original data. To see this level of correlation with noisy data gives us great confidence in the Multi-Sim calculations.
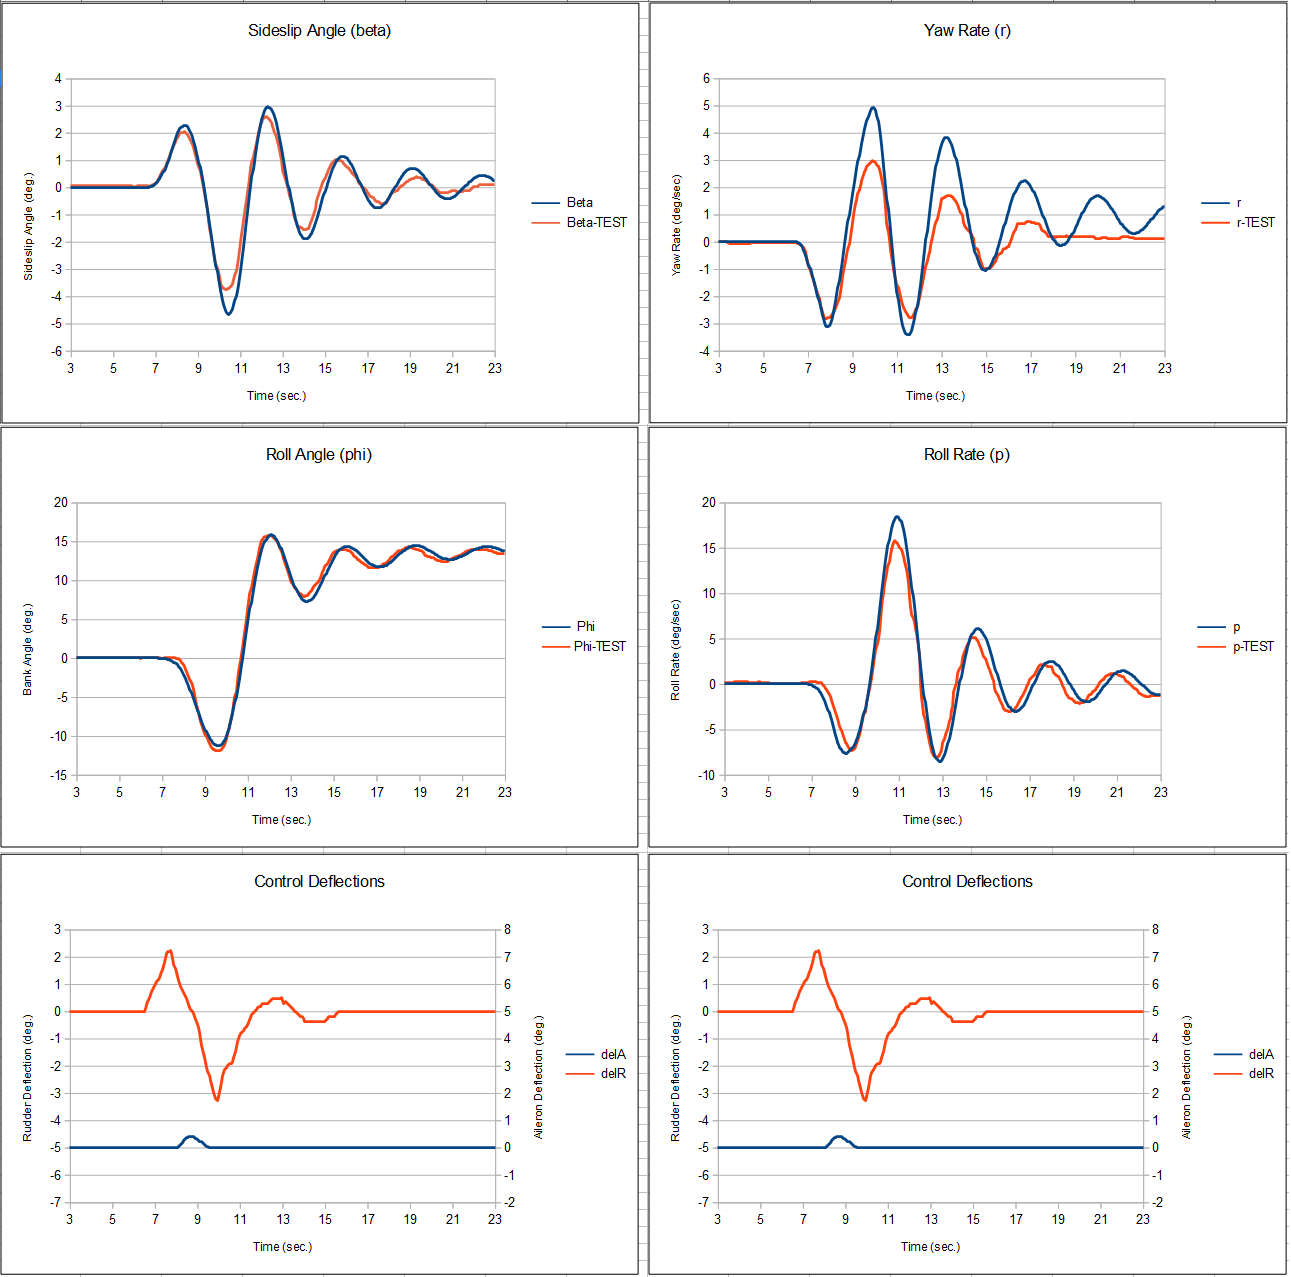
To the right, you can see the results of the rudder doublet. (Click to enlarge.) The column on the left shows the sideslip angle and roll angle responses of the aircraft to the control inputs. The bottom plot shows the measured positions of the real T-45's rudder and ailerons during the maneuver. The red curve is the rudder position and the blue curve is the aileron position. Normally there would be no aileron input during this maneuver, but the pilot accidentally moved the stick sideways while he was kicking the rudder pedals. The red curves in the sideslip and roll plots show the measured responses of the real T-45 to the control inputs. Again, we trimmed the simulated T-45 to the same starting conditions and then fed in the real control inputs. The blue curves show the response of the simulated T-45 to the maneuver. The correlation is exceptional--especially considering the fidelity of the input data. The right-hand column shows the yaw and roll rates of the T-45. These are essentially the first derivatives of the curves in the left-hand column. The control deflection plots are repeated at the bottom of the column for convenience.
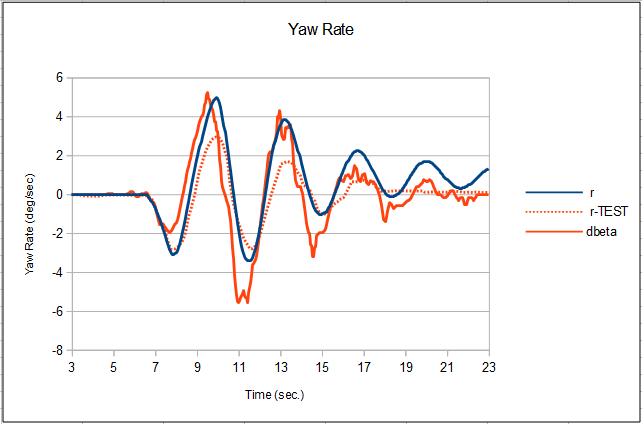
The roll rate plot shows the same excellent correlation as the roll angle plot. But the correlation of the yaw rate plot isn't nearly as good as that of the yaw angle plot. We ask, "Why the descrepancy in this one plot?" The figure to the left shows the same plot with a third curve. (Click to enlarge.) The measured yaw rate is now the dashed, red line. The solid red line is the numerically differentiated time-derivative of the measured sideslip angle. This value and the measured yaw rate curve should be close. They aren't. There seems to be a good deal of error beginning at about 7 seconds. From that point on, the measured yaw rate is simply wrong. But the derivative, on the other hand, shows reasonably good correlation with Multi-Sim's yaw rate prediction--what we would expect. We can conclude that something happened to the measured yaw rate data, either a sensor problem on the aircraft or a loss of fidelity due to the data being digitized from a copy of a copy. Multi-Sim's accuracy has allowed us to diagnose a problem with the data.
With these results, we feel certain that Multi-Sim is making accurate predictions--predictions you can trust.