Introduction:
I've been fascinated with engines since as far back as I can
remember. I find myself captivated by the sound of a Rolls
Royce Merlin or an Offy, both of which I was introduced to at
an early age. The castings, forgings and milled components
inside of an engine are some of the most beautiful jewelry I've
ever seen, all of it mystical. "How did someone know to make
it that way," I'd always ask.
 I took my first lawn mover engine apart when
I was about 10. I cleaned it up, lapped the valves and put it
back together. It ran like new! For a few years, I kept our
backyard cluttered with old lawn mowers that our neighbors had
thrown out. When I was a Junior in high-school, I
began working as a Honda motorcycle mechanic at a local shop. I worked
there part- and full-time for six years, right through college.
I absolutely loved the engines
in those motorcycles. They were all so beautifully designed
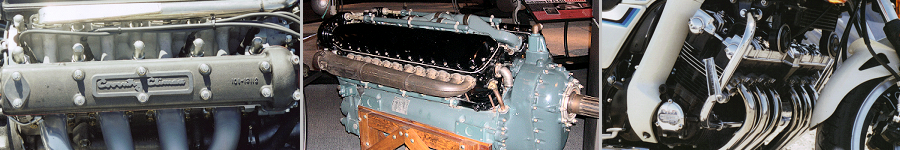
and built, the work of artists. My favorite engine was the
six-cylinder CBX, an absolute jewel of an engine, designed
by Soichiro Irimajiri (a brother Aero Engineer) and his team.
It's pictured in the masthead at the top of this page.
I took my first lawn mover engine apart when
I was about 10. I cleaned it up, lapped the valves and put it
back together. It ran like new! For a few years, I kept our
backyard cluttered with old lawn mowers that our neighbors had
thrown out. When I was a Junior in high-school, I
began working as a Honda motorcycle mechanic at a local shop. I worked
there part- and full-time for six years, right through college.
I absolutely loved the engines
in those motorcycles. They were all so beautifully designed
and built, the work of artists. My favorite engine was the
six-cylinder CBX, an absolute jewel of an engine, designed
by Soichiro Irimajiri (a brother Aero Engineer) and his team.
It's pictured in the masthead at the top of this page.
I always wanted to build my own engine and experiment to see
what made it work better or worse. I wanted to understand all
of the physics and dynamics that went on inside. At the speeds
that engines operate, I couldn't fathom how everything that is
supposed to happen could happen.
 And I wanted to
understand other mysteries, like how intake and exhaust tuning
worked; how the size of the cylinder bore and stroke affected
the power curve; how valve size, lift, timing and duration
affected the power curve; how the internal aerodynamics worked
and why engines are so inefficient. But with no milling
equipment at home, there was no chance of that. After college,
my fascination continued, but so did the dearth of machine tools.
And so, in 2002 I began the development of an engine simulation.
I figured that, if I can't have a Merlin of my own to play with,
perhaps I can simulate one and get my satisfaction that way.
And with a simulation, I could get answers to all of the other
questions I had. I could also use the simulation as an
engineering tool, to design new engines and components, to
improve or design intake and exhaust systems and to optimize
cam timing and geometry for specific applications.
And I wanted to
understand other mysteries, like how intake and exhaust tuning
worked; how the size of the cylinder bore and stroke affected
the power curve; how valve size, lift, timing and duration
affected the power curve; how the internal aerodynamics worked
and why engines are so inefficient. But with no milling
equipment at home, there was no chance of that. After college,
my fascination continued, but so did the dearth of machine tools.
And so, in 2002 I began the development of an engine simulation.
I figured that, if I can't have a Merlin of my own to play with,
perhaps I can simulate one and get my satisfaction that way.
And with a simulation, I could get answers to all of the other
questions I had. I could also use the simulation as an
engineering tool, to design new engines and components, to
improve or design intake and exhaust systems and to optimize
cam timing and geometry for specific applications.
The Simulation
The simulation is based on Computational Fluid Dynamics (CFD).
It's built from a collection of carefully crafted CFD models,
each targeted to model specific flows
within an engine, and all working in unison to recreate the full
spectrum of fluid physics that occur inside of an engine.
The models are all unsteady, time-accurate,
and compressible.
 The model of the fluid charge within the cylinder
includes combustion, radiant energy transfer to the cylinder
walls (and vice-versa) and blowby past the piston rings. Other
models account for the flows through the intake and exhaust
valves, through the intake runners and exhaust headers, and through
plenums, mufflers and exhaust pipes.
It may come as no surprise
that the physics of the charge within the cylinder are quite
violent, since that's where combustion occurs. But I found
that the physics of the flows through the valves and inside of
the intake and exhaust tracts are quite violent also. I found
supersonic flow in both the intake and exhaust tracts,
shock waves standing in the valve exits and then detaching and
traveling down the pipes, and the flows in both the intake and
the exhaust systems reversing wildly.
The model of the fluid charge within the cylinder
includes combustion, radiant energy transfer to the cylinder
walls (and vice-versa) and blowby past the piston rings. Other
models account for the flows through the intake and exhaust
valves, through the intake runners and exhaust headers, and through
plenums, mufflers and exhaust pipes.
It may come as no surprise
that the physics of the charge within the cylinder are quite
violent, since that's where combustion occurs. But I found
that the physics of the flows through the valves and inside of
the intake and exhaust tracts are quite violent also. I found
supersonic flow in both the intake and exhaust tracts,
shock waves standing in the valve exits and then detaching and
traveling down the pipes, and the flows in both the intake and
the exhaust systems reversing wildly.
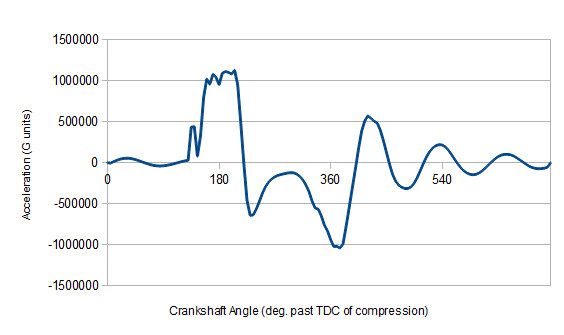
 The upper figure
to the right is from a run simulating a single-cylinder test
engine. (Click it for a larger version.) It shows the acceleration
experienced by the exhaust
gases at the atmospheric end of the exhaust header at 5,000 RPM.
First, note the motion. The gases are reversing, traveling both
out of and into the header. Next note the values. The exhaust
gases are experiencing a peak
acceleration of over 1 million Gs!
Those are the
kinds of figures we only expect to hear in cosmology. And yet,
here they are, in a machine that we can make with our own hands.
Getting CFD models to work and be accurate while simulating these
kinds of physics was very difficult.
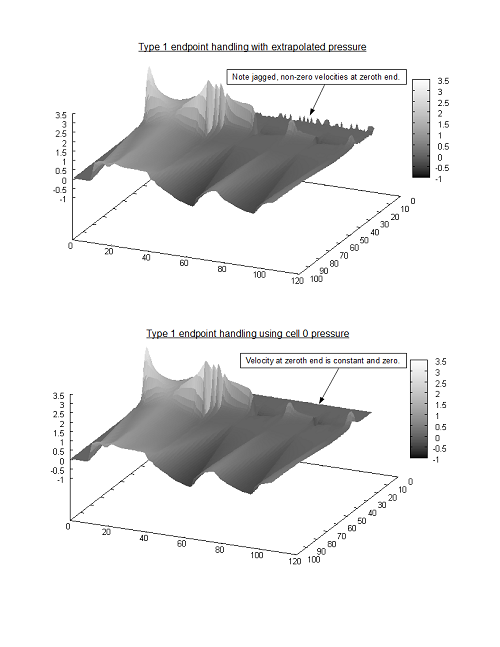
I ran into quite a few
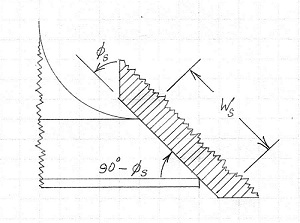
road blocks that I had to study and then surmount. The lower figure
to the right is an example. It shows the results of a test to
evaluate the numerical
endpoint handling where a valve connects to a cylinder. These
are the kinds of issues that had to be dealt with to make the
simulation happen. I've described a larger and more serious issue,
and the work required to account for it, in the short, informal
paper below
(originally written for the Aerospace Engineering department at
the Naval Postgraduate School):
The upper figure
to the right is from a run simulating a single-cylinder test
engine. (Click it for a larger version.) It shows the acceleration
experienced by the exhaust
gases at the atmospheric end of the exhaust header at 5,000 RPM.
First, note the motion. The gases are reversing, traveling both
out of and into the header. Next note the values. The exhaust
gases are experiencing a peak
acceleration of over 1 million Gs!
Those are the
kinds of figures we only expect to hear in cosmology. And yet,
here they are, in a machine that we can make with our own hands.
Getting CFD models to work and be accurate while simulating these
kinds of physics was very difficult.
I ran into quite a few
road blocks that I had to study and then surmount. The lower figure
to the right is an example. It shows the results of a test to
evaluate the numerical
endpoint handling where a valve connects to a cylinder. These
are the kinds of issues that had to be dealt with to make the
simulation happen. I've described a larger and more serious issue,
and the work required to account for it, in the short, informal
paper below
(originally written for the Aerospace Engineering department at
the Naval Postgraduate School):
 ( A paper on non-reflective boundary handling.)
When roadblocks appeared during development, I worked past them by talking with CFD experts on various subjects, attending conferences and doing lots and lots of research. In the process I learned more about CFD and math. And because of how rapidly and dependably I can write software, I think I may have more experience working with CFD models than nearly anyone else. In the process of creating the engine simulation I've literally written dozens of individual, free-standing CFD simulations, each used to examine a particular flow issue before being integrated into the overall engine simulation.
Here's an example of the simulation in action. The figure below shows the system simulating a single-cylinder engine. The simulation shows the engine's power peaking at 26 HP at 5900 RPM. Why does the power peak there? The figure is a surface plot of mach number for the flow through the whole intake tract (both valve and intake runner) at 6,000 RPM. The near edge of the surface represents the end of the intake valve where it connects to the cylinder. The far edge of the surface represents the atmospheric end of the intake runner. The surface indicates the mach number all along the intake tract. Going from front to back you travel along the intake runner. Going from right to left you advance in time with the rotation of the crankshaft. Starting at the near-right, the plot is flat because the intake valve is closed. Traveling left along the near edge, you can see where the valve opens, as the plot goes negative. (A negative mach number indicates flow toward the cylinder.) As the valve is closing, you can see a very deep point where the flow is below a mach number of negative 1. (The color is a deep blue/violet there.)
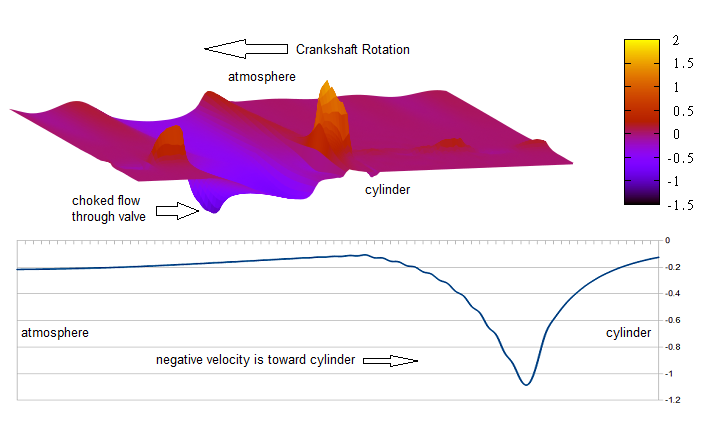
The line plot below the surface plot shows the velocity profile along the intake tract at that same moment in the crankshaft rotation. You can see that the flow has gone supersonic (a mach number of about -1.1) toward the cylinder. When the flow reaches Mach 1 through an enclosed space, like the gap between the valve and its seat, the mass flow rate reaches its maximum. It can't go any higher. We call this condition "choking", and this is how throttles and the valves on a sink work. With the flow through the valve choked, the mass flow rate through the intake is capped, limiting how much air/fuel mixture can enter the cylinder. As the RPM increases from this point, the valve will be open over a shorter and shorter period of time. And with the mass flow rate capped, that means that less and less mixture can flow into the cylinder. The result means that torque and power both drop off with increasing RPM. The only way for this engine to make more power is to increase the valve area, by using a larger diameter intake valve or by using two intake valves.
 I designed the simulation so that it could model an engine of
any configuration--inline, v, radial or any other, so long as
it has pistons in cylinders. I also designed it so that the
intake and exhaust systems could be specified simply, without
the need for a CAD system. And last, I designed it so that it could
generate a four-cylinder engine's power curve in two or so hours
on a desktop PC. All of those constraints limited the detail
of the physics that are modeled, and so I had to work carefully
to model the dominant physics while neglecting the non-dominant.
I designed the simulation so that it could model an engine of
any configuration--inline, v, radial or any other, so long as
it has pistons in cylinders. I also designed it so that the
intake and exhaust systems could be specified simply, without
the need for a CAD system. And last, I designed it so that it could
generate a four-cylinder engine's power curve in two or so hours
on a desktop PC. All of those constraints limited the detail
of the physics that are modeled, and so I had to work carefully
to model the dominant physics while neglecting the non-dominant.
Here is a white paper that I wrote on the engine simulation.
It shows the system in action, being used to analyze an engine
and then modify the engine for another use.
Around the same time that I finished developing the system,
I was talking with
the engineering director of a Formula 1 team. He asked me to
write up this short description of
the system, so that his engineers could compare it to the system that
they were using at the time.